Code
inputFile = '../01_input/water-1998.csv'code
This is just another opportunity to include code into a Quarto website using VSCode.
More information about that here
inputFile = '../01_input/water-1998.csv'import pandas as pd
import matplotlib.pyplot as pltwater = pd.read_csv(inputFile)
water.rename(columns={'1998': 'percentage'}, inplace=True)
water| Level | Compartment | percentage | |
|---|---|---|---|
| 0 | Total global water | Freshwater | 2.5 |
| 1 | Total global water | Salt water | 97.5 |
| 2 | Total global water | Total Global Water | 100.0 |
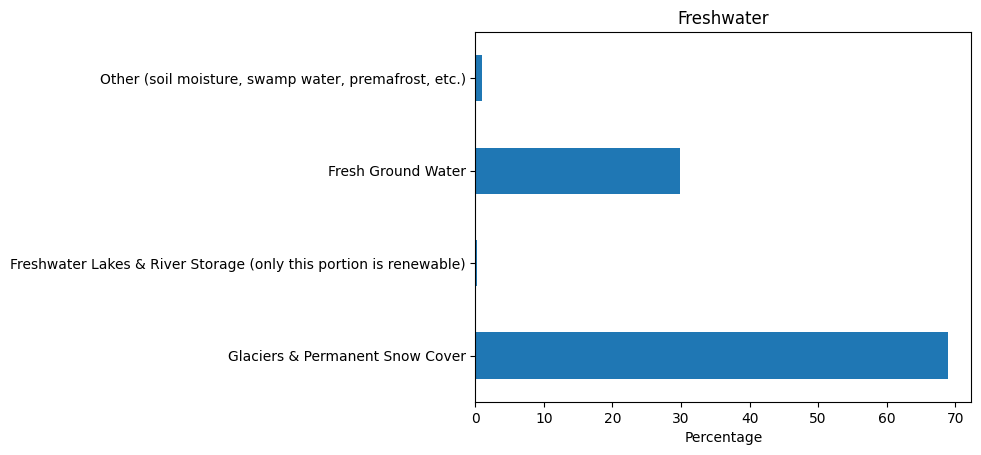
| 3 | Freshwater | Glaciers & Permanent Snow Cover | 68.9 |
| 4 | Freshwater | Freshwater Lakes & River Storage (only this po... | 0.3 |
| 5 | Freshwater | Fresh Ground Water | 29.9 |
| 6 | Freshwater | Other (soil moisture, swamp water, premafrost,... | 0.9 |
| 7 | Freshwater | Total Freshwater | 100.0 |
# Let's split the dataset into two pieces, one for each chart

# Global water
global_water = water[water['Level'] == 'Total global water']

# Delete the last row, as it is just the sum of the previous rows
global_water = global_water[:-1]

# Global water
fresh_water = water[water['Level'] == 'Freshwater']

# Delete the last row, as it is just the sum of the previous rows
fresh_water = fresh_water[:-1]# Create a pie chart with global_water
global_water.plot.pie(y='percentage', labels=global_water['Compartment'], autopct='%1.1f%%', figsize=(8, 8), legend=False)
plt.title('Global Total Water')
plt.ylabel('')
plt.gcf().set_size_inches(4, 4)
plt.show()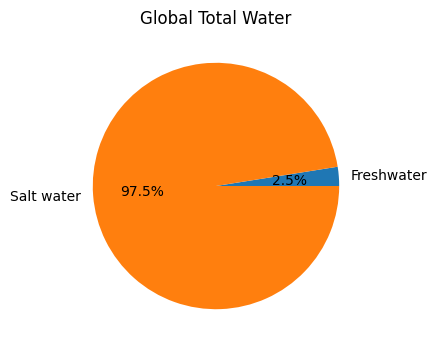
# Create a pie chart with fresh_water
fresh_water.plot.pie(y='percentage', labels=fresh_water['Compartment'], autopct='%1.1f%%', figsize=(8, 8), legend=False)
plt.title('Global Freshwater')
plt.ylabel('')
plt.gcf().set_size_inches(4, 4)
plt.show()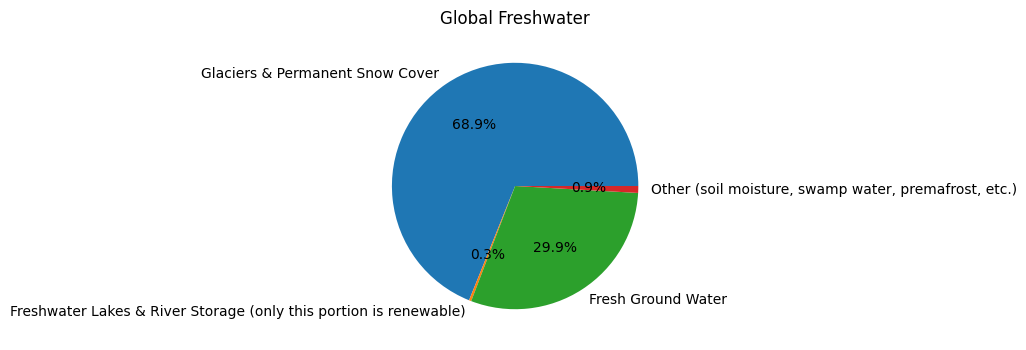
fig, axs = plt.subplots(1, 2, figsize=(11, 5))

# Plot global water pie chart
global_water.plot.pie(y='percentage', labels=global_water['Compartment'], autopct='%1.1f%%', ax=axs[0], legend=False)
axs[0].set_title('Global Total Water')
axs[0].set_ylabel('')

# Plot fresh water pie chart
fresh_water.plot.pie(y='percentage', labels=fresh_water['Compartment'], autopct='%1.1f%%', ax=axs[1], legend=False)
axs[1].set_title('Global Freshwater')
axs[1].set_ylabel('')

plt.show()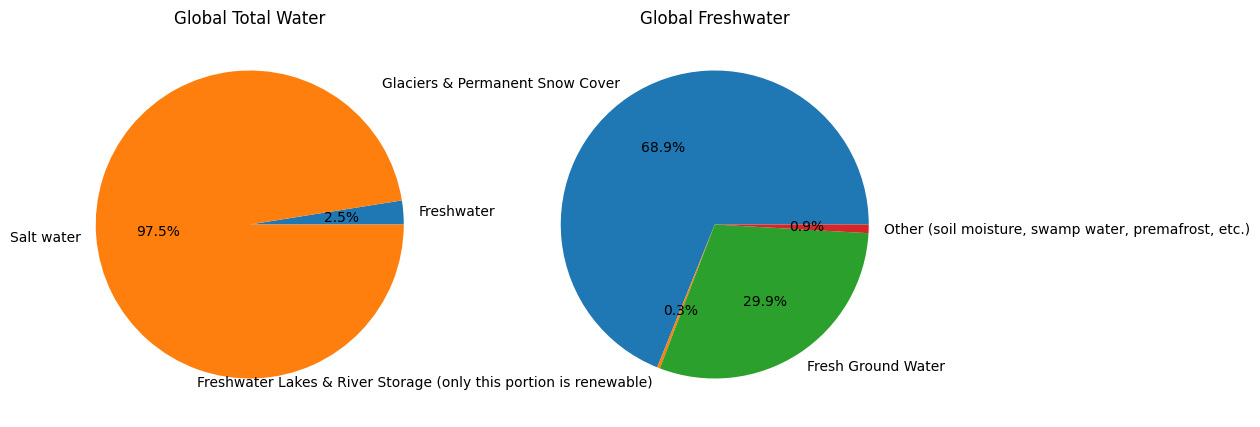
global_water.plot.barh(x='Compartment', y='percentage', legend=False)
plt.title('Global water')
plt.xlabel('Percentage')
plt.ylabel('')
plt.show()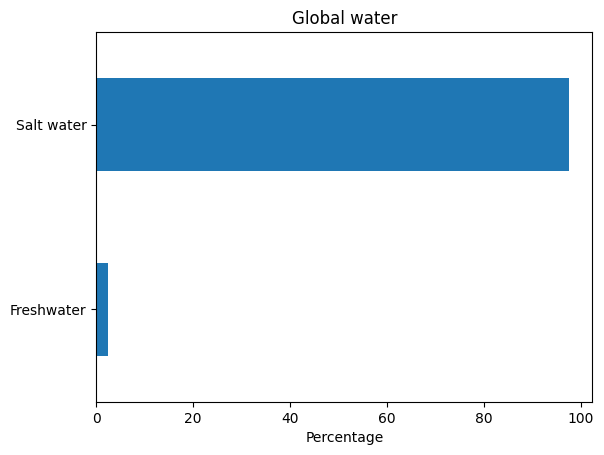
fresh_water.plot.barh(x='Compartment', y='percentage', legend=False)
plt.title('Freshwater')
plt.xlabel('Percentage')
plt.ylabel('')
plt.show()